Topic Data Arrival Alerts
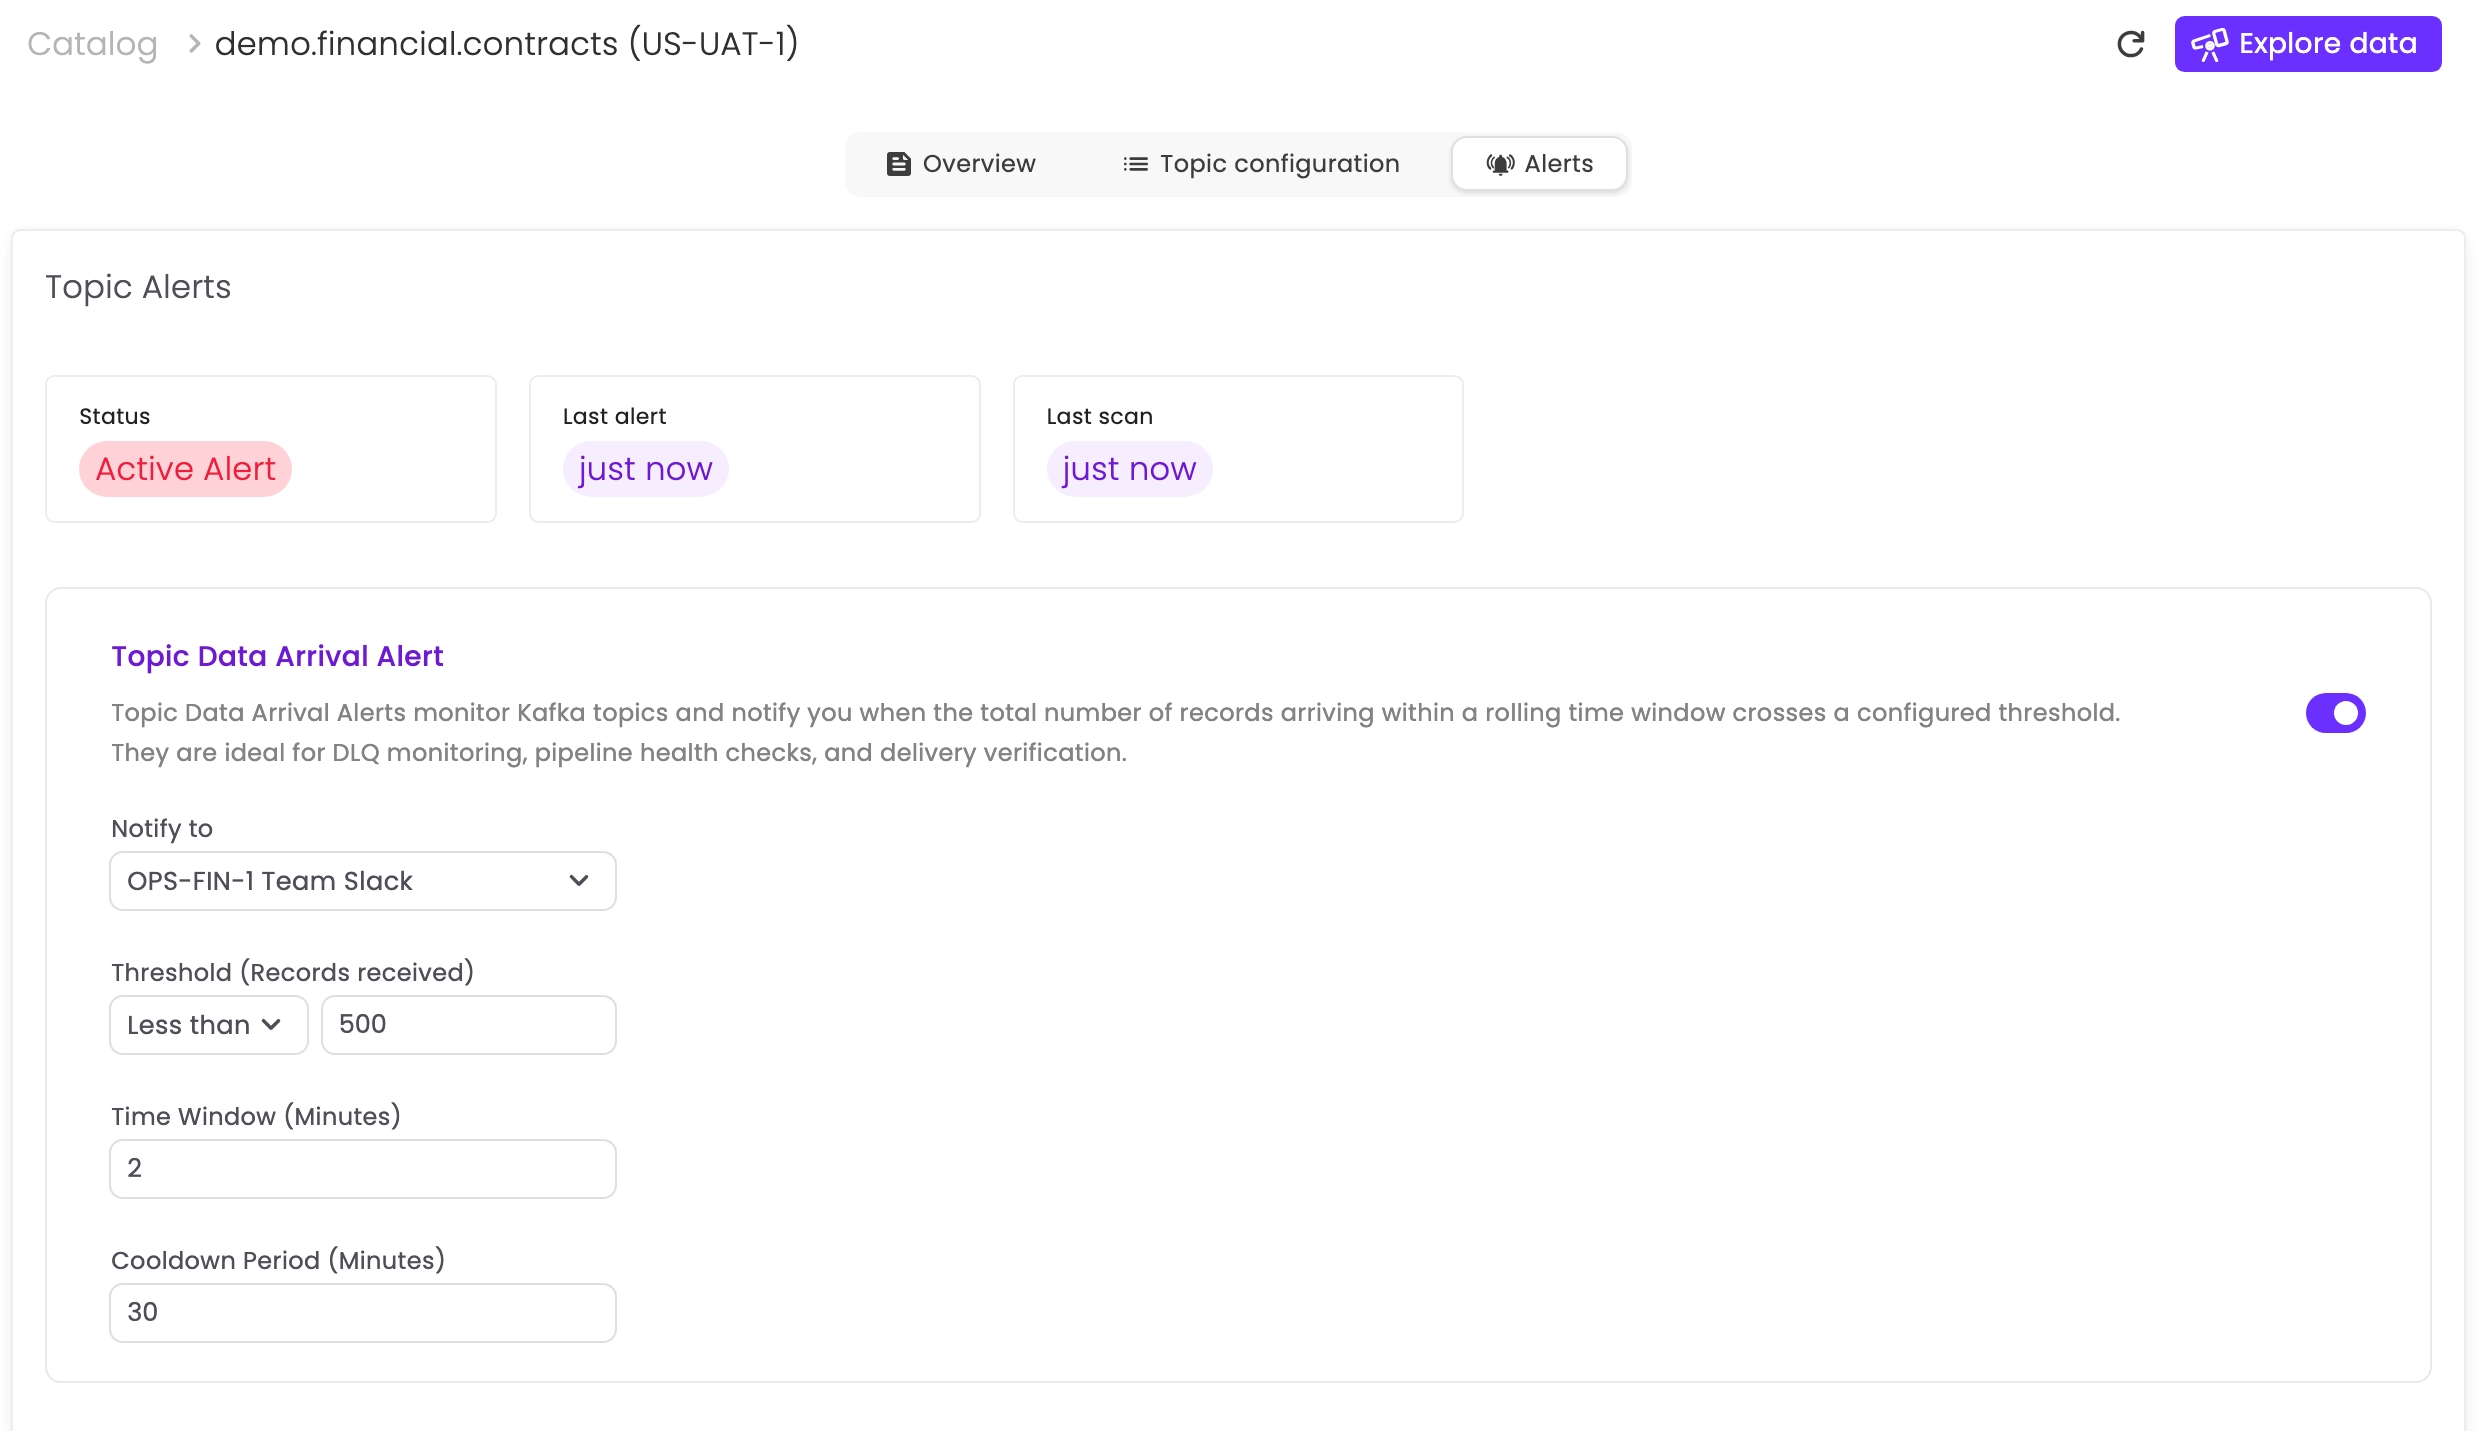
Topic Data Arrival Alerts monitor Kafka topics and notify you when the total number of records arriving within a rolling time window crosses a configured threshold. They are ideal for DLQ monitoring, pipeline health checks, and delivery verification.
Use cases
Use Topic Data Arrival Alerts to detect:
- DLQ activity: alert when any records arrive in DLQ topics (upstream failures).
- Unexpected spikes: alert when traffic exceeds a “greater than” threshold.
- Unexpected drops or silence: alert when traffic falls below a “less than” threshold, including no data arriving at all.
- Delivery verification: confirm expected data arrives within a defined window.
Permissions
Creating or editing topic alerts requires TopicAccessRead.
Audit logging
Alert creation and configuration changes are recorded in the audit log.
Configuration
You can configure alerts for topics available in the Data Catalog:
- Open Data Catalog
- Find the topic
- Click ⋯ next to the topic
- Select Configure Alerts
- Configure alerts in the Alerts section of the Topic Details page
Parameters
Notification integrations
Select one or more integrations to receive notifications when the alert triggers. Integrations are configured by administrators (see Alert Integrations).
Threshold condition
Define when the alert triggers:
- Condition: Greater than or Less than
- Record count: the number of records that must arrive within the time window
Time window
Kadeck continuously counts arriving records over a rolling time window (in minutes). Counts are computed as the topic total across all partitions.
- Greater than N triggers when more than N records arrive within any rolling time window.
- Less than N triggers when fewer than N records arrive within any rolling time window.
No-data detection: A configuration of Less than 1 triggers if zero records arrive within the specified time window.
Examples:
- Greater than 1000 in 5 minutes triggers when more than 1000 records arrive within any rolling 5-minute window.
- Less than 1 in 10 minutes triggers if no records arrive within any rolling 10-minute window.
Cooldown period
The minimum time (in minutes) before the same alert can trigger again. This reduces alert noise and prevents flooding.
Example: With 30 minutes, after sending an alert, Kadeck waits at least 30 minutes before triggering that alert again, even if the condition remains true.
How it works
- Alerts are evaluated continuously using the configured Time window.
- When the Threshold condition is met, Kadeck triggers the alert and notifies the selected integrations.
- During the Cooldown period, the alert will not trigger again.
Filtering topics with alerts
In the Data Catalog, filter for topics that have alerts configured using the alerts-configured tag.
Example: DLQ monitoring
A typical DLQ alert:
- Integration: Ops Team Slack
- Condition: Greater than 0
- Time window: 1 minute
- Cooldown: 15 minutes
This notifies the team whenever messages arrive in the DLQ topic. The 1-minute window reduces noise from transient bursts; the cooldown prevents repeated alerts for the same ongoing incident.
Example: “pipeline silent” monitoring
A typical “no delivery” alert:
- Integration: PagerDuty
- Condition: Less than 1
- Time window: 10 minutes
- Cooldown: 30 minutes
This alerts when no records arrive in the topic within a rolling 10-minute window, which often indicates an upstream outage or stalled pipeline.