Flow Visualizer
The Flow Visualizer turns a topic set into a diagram of your data flow. You arrange the topics of the set on a canvas, connect them through the applications that read from and write to them, and trace a record on its way from topic to topic. It is ideal for architecture reviews, incident analysis, and product demos, wherever a flow such as topic A → application → topic B should be understood at a glance.
Use cases
Use the Flow Visualizer to:
- Explain a data flow: draw which applications produce to and consume from the topics of a set and show the result to colleagues or stakeholders.
- Trace a record: enter a key, a header, or an attribute value and see in which order the matching records passed through the topics.
- Jump to the evidence: click a step of the trace to highlight the corresponding record in the record list.
- Document an investigation: save the diagram with the set, so everyone who opens the set sees the same picture.
Key concepts
Canvas
The Flow Visualizer is the first tab above the record list whenever a topic set is open. Every view of the set appears as a topic node in the color of its view, with the topic name, the view name (unless it is the default view), and the number of records currently shown.
Important: The canvas is a drawing that you create yourself. Kadeck does not derive it from the consumer groups or producers of the cluster; every application and every connection on the canvas is added by you.
Applications
Topics are never connected directly. When you connect two topics, Kadeck places an application node between them, because it is always an application that reads from one topic and writes to another.
An application can be connected to any number of topics: it can consume from several topics and produce to several topics. Applications only exist on the canvas of the set. They are not linked to a consumer group or a deployment.
Trace
A trace follows one value, for example a record key, through the topics of the set. Kadeck finds all matching records, orders them, and places a sequence number (1, 2, 3, …) on the topic node each record belongs to.
A trace is calculated from the records that are loaded in All combined. Which records these are depends on the display settings and filters of the views, as described in Topic Sets.
Working with the Flow Visualizer
Open the Flow Visualizer
- Open a topic set in the Explorer, or create one by adding a second topic or view.
- Select the Flow visualizer tab above the record list. It is selected by default when you open a set.
New topics start unconnected and can be arranged freely.
Arrange the canvas
- Move a node: drag it to a new position.
- Move the canvas: drag the background.
- Zoom: click − or + in the status line below the canvas, or hold Ctrl (Cmd on macOS) and scroll.
- Fit: click Fit to show all nodes.
- Expand: click Expand to use the whole view for the canvas, and Collapse to show the record list again.
Very long topic names are shortened at the beginning, where the names of a cluster are usually alike. Hover over a node to see the full name.
Connect topics
Every node has two connection points: the left one is its input, the right one its output.
- Drag from the connection point on the right of a topic to another topic.
- Kadeck inserts an application between the two topics and connects it to both.
To connect an application to further topics, drag from a connection point of the application to a topic, or from a topic to the application. A connection that starts on the right of a node leads away from it; a connection that starts on the left leads towards it.
Click + Application to add an application that is not connected yet.
Rename and remove applications
- Rename: double-click an application, or select it and press Enter. Confirm with Enter, cancel with Esc.
- Remove an application: select it and click Remove application, or press Delete. Its connections are removed as well.
- Remove a connection: click the connection and click Remove connection, or press Delete.
Topic nodes cannot be removed on the canvas. To remove a topic, remove its view from the set.
Calculate a trace
- In the Trace control above the canvas, select the property to follow.
- Enter the value to follow. For Header and Value attribute, also enter the name of the header or the path of the attribute.
- Select the order of the trace.
- Click Calculate trace.
Kadeck switches to All combined if a single view is selected and numbers the matching records on the topic nodes. Click Clear trace to remove the numbers.
Jump from a step to its record
Click a sequence number on a topic node to highlight the corresponding record in the record list. If the canvas is expanded, it collapses first; if the record is further down the list, the list scrolls to it.
Save the diagram
The diagram is part of the topic set. Click Save changes or File → Save set to store:
- the position of every node,
- the applications and their names,
- the connections,
- the settings of the last trace.
Parameters
Property
Defines what a record must have in common with the value you enter:
- Record key: the key of the record.
- Header: a header of the record. Header names are not case-sensitive.
- Value attribute: an attribute of the record value, given as a path, for example
order.id. - Trace ID (OpenTracing): the trace ID from the tracing headers of the record.
A record matches if the property is exactly the value you entered. Keys and attributes that are objects are compared with their JSON text.
Order
Defines how the matching records are numbered:
- By timestamp: the records are ordered by their timestamp.
- By OpenTracing context: a record is never placed before the record that carries its parent span, even if the clocks of the producers say otherwise. All other records are ordered by timestamp.
Kadeck reads the tracing context from the headers uber-trace-id (Jaeger), b3 and X-B3-* (Zipkin), and traceparent (W3C Trace Context).
How it works
- A trace is evaluated against the records loaded in All combined. When new records arrive, for example in live mode, the numbers are updated.
- The status line below the canvas shows how many records were found, in how many topics, and the time between the first and the last record.
- A connection is highlighted if two consecutive steps of the trace lie in two topics and an application is drawn from the first topic to the second.
- A topic node shows up to six sequence numbers. Further matching records in the same topic are summed up as +n.
- If no loaded record matches, add a search or filter in All combined to load records from further back.
Example: following a corrected record
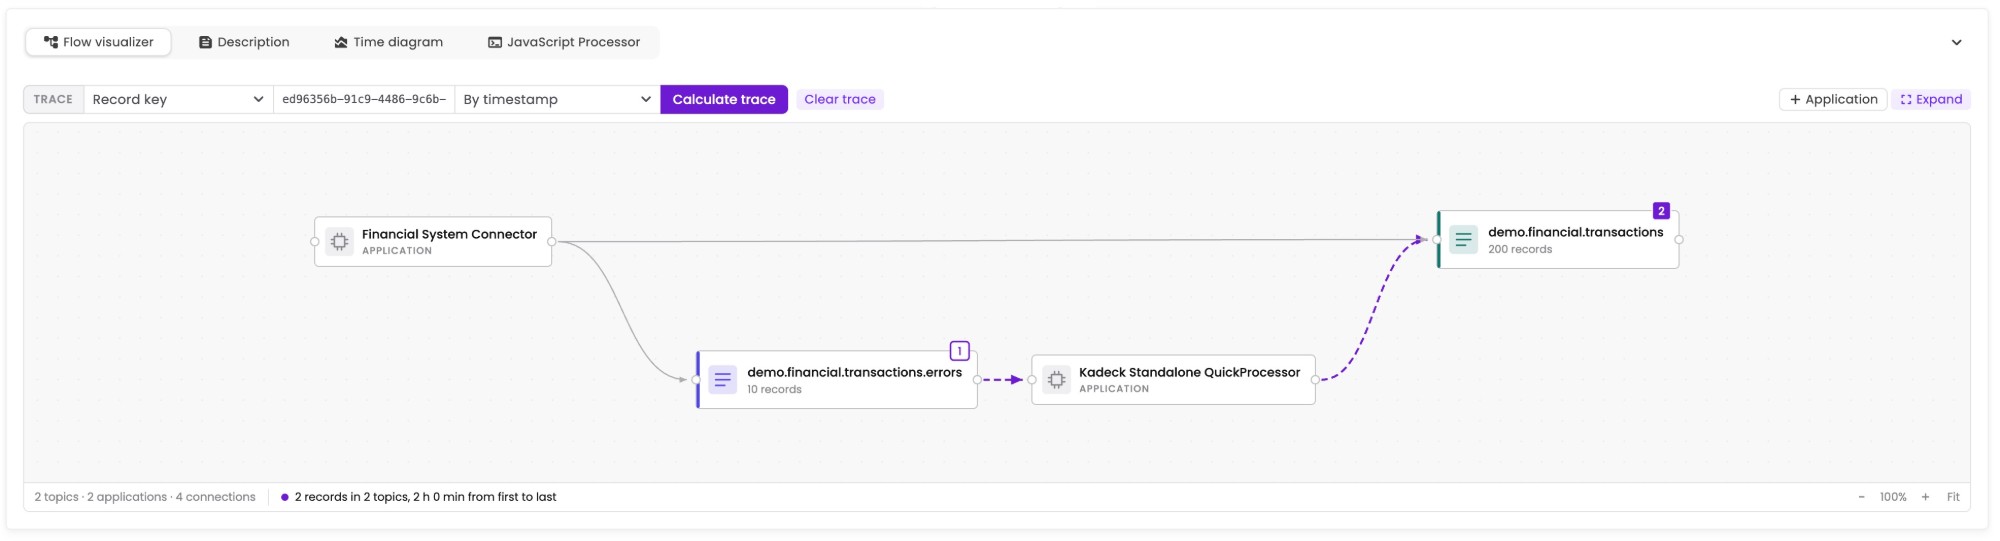
The screenshot above shows a set with the topics demo.financial.transactions and demo.financial.transactions.errors:
- Financial System Connector produces to both topics.
- Kadeck Standalone QuickProcessor reads from
demo.financial.transactions.errorsand writes todemo.financial.transactions. - Property: Record key
- Order: By timestamp
The trace finds two records with the same key: step 1 in the errors topic and step 2 in demo.financial.transactions, two hours later. The highlighted connections show that the record took the path through the QuickProcessor, not the direct connection from the connector.
Limitations
- A trace only considers records that are loaded in All combined. Records outside the display settings of the views are not found.
- The Lineage tab is not available for topic sets. It is shown when a single topic or view is open outside of a set.
- The canvas does not validate the drawing against the cluster. It shows the flow as you describe it.
Permissions
- Data access: the Flow Visualizer shows the views of the set. A user needs
TopicAccessReadfor every topic of the set; topics that are not available are skipped by a trace. - Saving: the diagram is saved with the topic set and follows the same rules as saving topic sets.
Audit logging
The diagram is stored when the topic set is saved. Saving a topic set is recorded in the audit log.